%% plotting
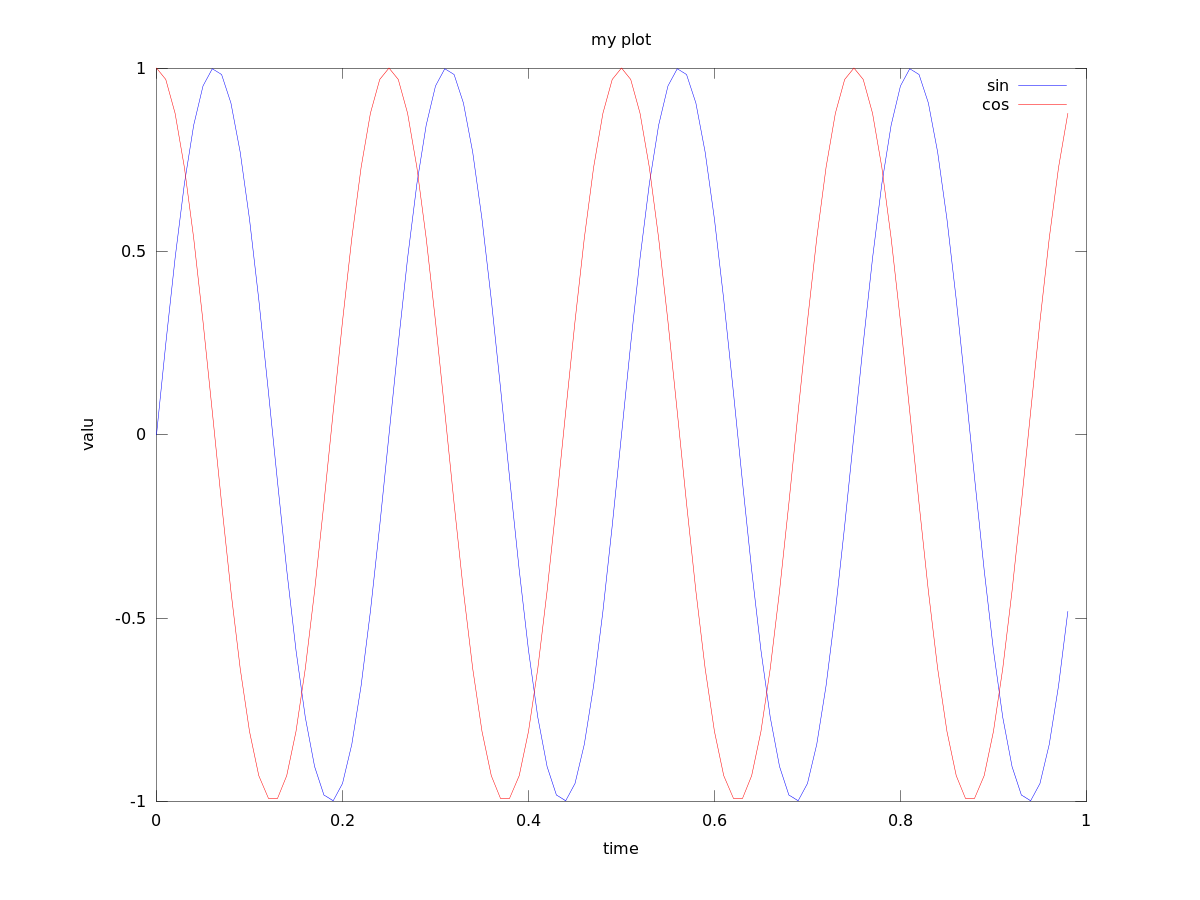
>>t = [0:0.01:0.98];
>>y1 = sin(2*pi*4*t);
>>plot(t,y1);
>>y2 = cos(2*pi*4*t);
>>hold on; % "hold off" to turn off
>>plot(t,y2,'r');
>>xlabel('time');
>>ylabel('value');
>>legend('sin','cos');
>>title('my plot');
>>print -dpng 'myPlot.png'
>>close; % or, "close all" to close all figs
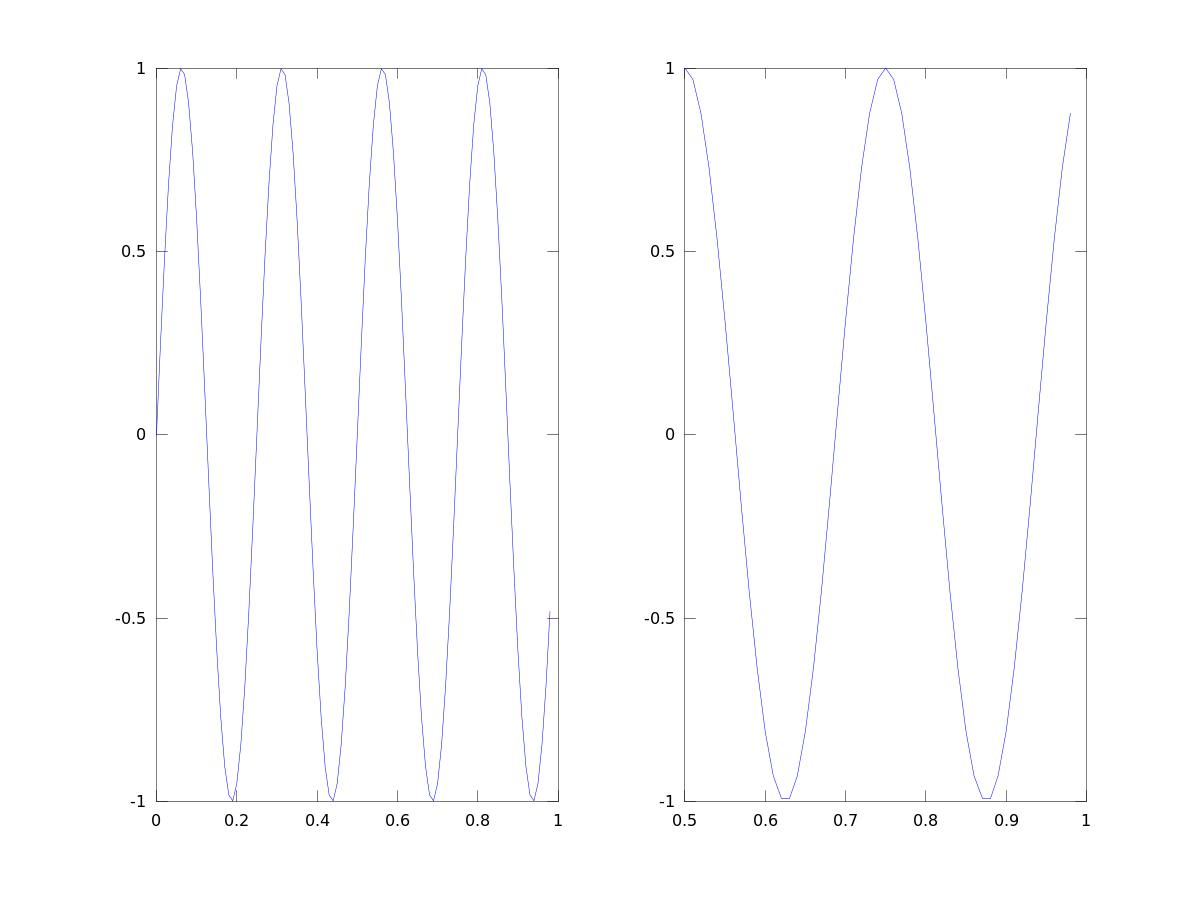
>>figure(2), clf; % can specify the figure number
>>subplot(1,2,1); % Divide plot into 1x2 grid, access 1st element
>>plot(t,y1);
>>subplot(1,2,2); % Divide plot into 1x2 grid, access 2nd element
>>plot(t,y2);
>>axis([0.5 1 -1 1]); % change axis scale
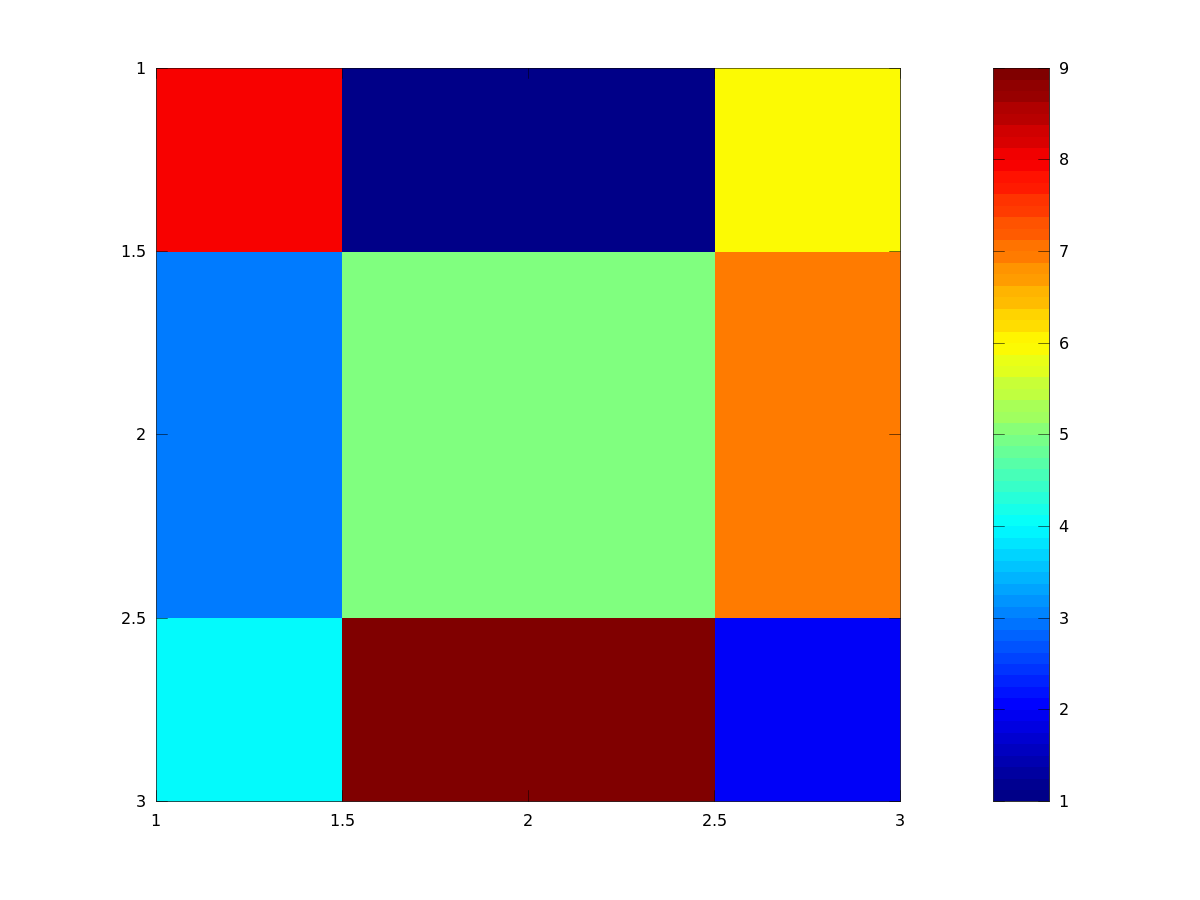
>>%% display a matrix (or image)
>>figure;
>>imagesc(magic(15)), colorbar, colormap gray;
>>% comma-chaining function calls.
>>a=1,b=2,c=3
>>a=1;b=2;c=3;利用plot生成的图: